Download
1 / 26
730 likes | 3.9k Views
Infectious Disease Epidemiology. Principles of Epidemiology Lecture 7 Dona Schneider , PhD, MPH, FACE. Concepts in Infectious Epidemiology. Agent, host, environment Classification of human infections by modes of transportation Incubation period Spectrum of disease Herd immunity.
 liam
liam

E N D
Infectious Disease Epidemiology Principles of Epidemiology Lecture 7 Dona Schneider, PhD, MPH, FACE
Concepts in Infectious Epidemiology • Agent, host, environment • Classification of human infections by modes of transportation • Incubation period • Spectrum of disease • Herd immunity
Major Factors Contributing to the Emergence of Infectious Diseases • Human demographics and behavior • Technology and industry • Economic development and land use • International travel and commerce • Microbial adaptation and change • Breakdown of public health measures
Epidemiologic Triad Concepts • Infectivity – ability to invade a host (# infected / # susceptible) X 100 • Pathogenicity – ability to cause disease (# with clinical disease / # of infected) X 100 • Virulence – ability to cause death (# of deaths / # with disease (cases)) X 100 • All are dependent upon the condition of the host • Immunity (active, passive) • Nutrition • Sleep • Hygiene
Mode of Transmission • Person-to-person (respiratory, orogenital, skin) • Examples: HIV, measles • Vector (animals, insects) • Examples: rabies, yellow fever • Common vehicle (food, water) • Examples: salmonellosis • Mechanical vectors (personal effects) such as doorknobs, or toothbrushes are called FOMITES
Classification by Mode of Transmission • Dynamics of Spread through Human Populations • Spread by a common vehicle • Ingestion Salmonellosis • Inhalation Legionellosis • Inoculation Hepatitis • Propagation by serial transfer from host to host • Respiratory Measles • Anal-oral Shigellosis • Genital Syphilis
Principle Reservoir of Infection • Man Infectious hepatitis • Other vertebrates (zoonoses) Tularemia • Agent free-living Histoplasmosis • Portal of Entry/Exit in Human Host • Upper respiratory tract Diphtheria • Lower respiratory tract Tuberculosis • Gastrointestinal tract Typhoid fever • Genitourinary tract Gonorrhea • Conjunctiva Trachoma • Percutaneous Leptospirosis • Percutaneous (bite of arthropod) Yellow fever
Cycles of Infectious Agent in Nature • Man-man Influenza • Man-arthropod-man Malaria • Vertebrate-vertebrate-man Psittacosis • Vertebrate-arthropod-vertebrate-man Viral encephalitis • Complex Cycles • Helminth infections River blindness
Incubation Period • The interval between the time of contact and/or entry of the agent and onset of illness (latency period) • The time required for the multiplication of microorganisms within the host up to a threshold where the parasitic population is large enough to produce symptoms
Each infectious disease has a characteristic incubation period, dependent upon the rate of growth of the organism in the host and • Dosage of the infectious agent • Portal of entry • Immune response of the host • Because of the interplay of these factors, incubation period will vary among individuals • For groups of cases, the distribution will be a curve with cases with longer incubation periods creating a right skew
Spectrum of Disease • Exposure • Subclinical manifestations • Pathological changes • Symptoms • Clinical illness • Time of diagnosis • Death • Whether a person passes through all these stages will depend upon infection and prevention, detection and therapeutic measures
CELL RESPONSE HOST RESPONSE Iceberg Concept of Infection Lysis of cell Fatal Discernable effect Clinical and severe disease Clinical Disease Cell transformation or Cell dysfunction Moderate severity Mild Illness Incomplete viral maturation Infection without clinical illness Below visual change Subclinical Disease Exposure without cell entry Exposure without infection
Spectrum of Disease (cont.) • Example • 90% of measles cases exhibit clinical symptoms • 66% of mumps cases exhibit clinical symptoms • <10% of poliomyelitis cases exhibit clinical symptoms Inapparent infections play a role in transmission. These are distinguished from latent infections where the agent is not shed
Subclinical/Clinical Ratio for Viral Infections Virus Clinical feature Age at infection Estimated ratio Clinical cases + 1000:1 Paralysis Child Polio 0.1% to 1.0% Mononucleosis 1 to 5 years Epstein-Barr > 100:1 1% 6 to 15 years 10:1 to 100:1 1% to 10% 16 to 25 years 2:1 to 3:1 50% to 75% Hepatitis A Icterus < 5 years 20:1 5% 5 to 9 years 11:1 10% 10 to 15 years 7:1 14% Adult 1.5:1 80% to 95% Rubella Rash 5 to 20 years 2:1 50% Influenza Fever, cough Young adult 1.5:1 60% Measles Rash, fever 5 to 20 years 1:99 >99% CNS symptoms <1:10,000 Rabies Any age >>>>99%
Herd Immunity • The decreased probability that a group will develop an epidemic because the proportion of immune individuals reduces the chance of contact between infected and susceptible persons • The entire population does not have to be immunized to prevent the occurrence of an epidemic • Example: smallpox, measles
Investigating an Epidemic • Determine whether there is an outbreak – an excess number of cases from what would be expected • There must be clarity in case definition and diagnostic verification for each case
Investigating an Epidemic (cont.) • Plot an epidemic curve (cases against time) • Calculate attack rates • If there is no obvious commonality for the outbreak, calculate attack rates based on demographic variables (hepatitis in a community) • If there is an obvious commonality for the outbreak, calculate attack rates based on exposure status (a church supper)
Investigating an Epidemic (cont.) • Determine the source of the epidemic • If there is no obvious commonality for the outbreak, plot the geographic distribution of cases by residence/work/school/location to reduce common exposures • If there is an obvious commonality for the outbreak, identify the most likely cause and investigate the source to prevent future outbreaks
Index Case • Person that comes to the attention of public health authorities • Primary Case • Person who acquires the disease from an exposure • Attack rate • Secondary Case • Person who acquires the disease from an exposure to the primary case • Secondary attack rate
Calculation of Attack Rate for Food X Ate the food (exposed) Did not eat the food (not exposed) Attack Rate Attack Rate Ill Well Total Well Total Ill 10 3 13 76% 7 4 11 64% Attack Rate = Ill / (Ill + Well) x 100 during a time period Attack rate = (10/13) x 100 = 76% ( 7/11) x 100 = 64% RR = 75/64 = 1.2
Secondary Attack Rate Secondary attack rate (%) Total number of cases – initial case(s) • Used to estimate to the spread of disease in a family, household, dorm or other group environment. • Measures the infectivity of the agent and the effects of prophylactic agents (e.g. vaccine) = x 100 Number of susceptible persons in the group – initial case(s)
Mumps experience of 390 families exposed to a primary case within the family Population Cases No. susceptible before primary cases occurred Age in years Total Primary Secondary 2-4 300 250 100 50 5-9 450 204 87 420 10-19 152 84 25 15 Secondary attack rate 2-4 years old = (150-100)/(250-100) x 100 = 33%
Case Fatality Rate Number of deaths due to disease X • Reflects the fatal outcome (deadliness) of a disease, which is affected by efficacy of treatment Case fatality rate (%) = x 100 Number of cases of disease X
Assume a population of 1000 people. In one year, 20 are sick with cholera and 6 die from the disease. The cause-specific mortality rate in that year from cholera = The case-fatality rate from cholera = 6 = 0.006 = 0.6% 1000 6 = 0.3 = 30% 20
Infectious Disease Epidemiology. Sharyn Orton, Ph.D. American Red Cross, Rockville, MD Suggested reading: Modern Infectious Disease Epidemiology (1994) by Johan Giesecke Modern Epidemiology (1998) by Kenneth Rothman and Sander Greenland.
1.28k views • 25 slides
Part III: Infectious Disease Epidemiology. Epidemics & Their Control. Epidemiological Triad for Infectious Disease. Agent. Environment. Host. Notifiable Diseases.
3.04k views • 207 slides
The Epidemiology of Infectious Disease . Introduction. I. The Science of Epidemiology. Epidemiology: The field of science concerned with the circumstances under which diseases occur An epidemiologist works in this field Factors under investigation:
1.6k views • 65 slides

799 views • 15 slides
Infectious Disease Epidemiology . EPIET Introductory Course, 2011 Lazareto, Menorca, Spain. Mike Catchpole, Bernadette Gergonne, James Stuart, Outi Lyytikäinen, Viviane Bremer. Objective. to review importance and specific concepts of infectious disease epidemiology.
1.37k views • 34 slides

Infectious Disease Epidemiology. Principles of Epidemiology Lecture 7 Dona Schneider , PhD, MPH, FACE. Concepts in Infectious Epidemiology. Agent, host, environment Classification of human infections by modes of transportation Incubation period Spectrum of disease Herd immunity.
640 views • 26 slides
The Epidemiology of Infectious Disease. Chapter 37 Todd Kitten, Ph.D. Epidemiology. The science that evaluates occurrence, determinants, distribution, and control of health and disease in a defined human population
1.19k views • 55 slides
ID 2. Emerging Pathogens. AnthraxVancomycin-resistant enterococcus (VRE)Penicillin-resistant Strep pneumoniaeMethicillin-resistant Staph aureus (MRSA)West Nile virus. ID 3. Anthrax. Inhalation Anthrax is not pneumoniaHemorrhagic mediastinitis, widened mediastinum on CXRInhaled spores deposit i
1.1k views • 77 slides

2. Infectious Disease Public Health Surveillance and Response. SURVEILLANCEWhat is the problem?Reportable diseases.. RISK FACTORSWho is at risk?Data analysis. INTERVENTIONSolve the problem?Disseminate informationGood policy and service. EVALUATIONDoes it work?Data and Feed back.Fix it.. .
406 views • 26 slides
Class test on Infectious Disease Epidemiology. Dr. Pracheth R. MD, DNB, PGDipPHSM. Modes of transmission. Direct contact: Direct contact: STD, leprosy Droplet infection Soil Innocculation into skin/mucosa Transplacental /vertical. Indirect ( Flies , fingers, fomites, food, fluid).
708 views • 48 slides
Infectious Disease Epidemiology. Casey E. Barton, M.S. July 26, 2001. REMINDERS!!!!!!!!!!. TODAY by 5pm Submit all outstanding homeworks and redos July 31 st Teaching-Learning Exam Course Evaluations Tutorial after class August 2 nd FINAL EXAM Last day of class!!!!!!!.
838 views • 47 slides
INFECTIOUS DISEASE EPIDEMIOLOGY Maj Fawad. Topics to be covered in this lecture. Definitions Dynamics of Infectious Disease Transmission Control of Infection. Terms . 1. Disease. Manifest / Overt. Inapparent / Asymptomatic / Subclinical / Covert. Latent. Colonization.
959 views • 64 slides
Infectious Disease. BMT Mrs. Cavanaugh. Disease Condition that impairs normal tissue function. Examples include: Cystic Fibrosis Atherosclerosis measles. Infectious Disease
666 views • 34 slides
Division of Disease Control Epidemiology and infectious disease surveillance. Michelle Feist Program Manager, NDDoH. Outline. Surveillance and Epidemiology Disease and Outbreak Reporting Current and Emerging Communicable Diseases. Epidemiology.
759 views • 33 slides
Infectious Disease. DO NOW. 10 Weird Health Clues. Chapter 33 Open Note Quiz. On Page 972, answer questions 1, 3, 13-20, 23-28. Homework due today. Read 35.1 Answer Questions 1a, 1b, 2a on 1013 Open note quiz. Review Homework due today. List the types of organisms that can cause disease
447 views • 16 slides
Infectious Disease. WHAT IS AN INFECTIOUS DISEASE?. Bacteria, viruses, protozoans, fungi, and other parasites called pathogens are capable of causing a change that disrupts the homeostasis in the body.
469 views • 20 slides
Unit 12-13: Infectious Disease Epidemiology. Unit 12-13 Learning Objectives: Understand primary definitions used in infectious disease epidemiology. Differentiate between direct and indirect modes of infectious disease transmission. Understand the concept of herd immunity.
560 views • 21 slides
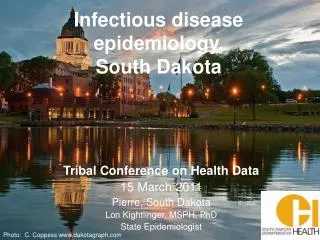
Infectious disease epidemiology, South Dakota. Tribal Conference on Health Data 15 March 2011 Pierre, South Dakota Lon Kightlinger, MSPH, PhD State Epidemiologist. Photo: C. Coppess www.dakotagraph.com. Infectious Disease Public Health Surveillance and Response. SURVEILLANCE
473 views • 26 slides
EPIDEMIOLOGY, INFECTIOUS DISEASES. Department of Microbiology and Infectious Diseases Budapest, XIV. Hungária krt. 23-25. Telephone: 251.9900 Internal phone: 8090, 8091 Fax: 251.9260 E-mail: Fodor.Laszlo@aotk.szie.hu. Department of Microbiology and Infectious Diseases Lectures
984 views • 40 slides

Principles of Infectious Disease Epidemiology. Infectious disease. Definition
878 views • 46 slides
Infectious Disease. Bacteria: Friend or Enemy?. WHAT IS AN INFECTIOUS DISEASE?. Pathogens:. Bacteria, viruses, parasites, and fungi, called pathogens are capable of causing a change that disrupts the homeostasis in the body.
320 views • 27 slides
Infectious Disease Epidemiology and Transmission Dynamics. Ann Burchell Invited lecture EPIB 695 McGill University April 3, 2007. Objectives. To understand the major differences between infectious and non-infectious disease epidemiology
546 views • 39 slides
玻璃钢生产厂家毕节商场美陈生产河西商场装饰美陈渭南玻璃钢人物雕塑南宁户内玻璃钢雕塑定做价格宣威市玻璃钢雕塑批发价格山东商场创意商业美陈怎么样如皋玻璃钢雕塑服务热线绍兴玻璃钢陶瓷雕塑价格益阳长沙玻璃钢雕塑厂家哪家好聊城玻璃钢门头雕塑5月商场美陈朝阳园林玻璃钢雕塑安装美陈玻璃钢动物雕塑批发大连玻璃钢雕塑类别天津电镀玻璃钢雕塑饰品临沂玻璃钢胸像雕塑玻璃钢南瓜屋雕塑厂家沈阳小区玻璃钢雕塑生产厂家余杭区玻璃钢金属雕塑私人定做中山玻璃钢动物卡通雕塑拉萨玻璃钢雕塑厂南通玻璃钢雕塑制作公园玻璃钢雕塑收费玻璃钢花盆制品厂家直销江门玻璃钢雕塑生产厂家浙江开业商场美陈批发陕西仿古玻璃钢卡通雕塑保山玻璃钢伟人像雕塑南阳公园标识玻璃钢雕塑玻璃钢花盆制品工厂香港通过《维护国家安全条例》两大学生合买彩票中奖一人不认账让美丽中国“从细节出发”19岁小伙救下5人后溺亡 多方发声单亲妈妈陷入热恋 14岁儿子报警汪小菲曝离婚始末遭遇山火的松茸之乡雅江山火三名扑火人员牺牲系谣言何赛飞追着代拍打萧美琴窜访捷克 外交部回应卫健委通报少年有偿捐血浆16次猝死手机成瘾是影响睡眠质量重要因素高校汽车撞人致3死16伤 司机系学生315晚会后胖东来又人满为患了小米汽车超级工厂正式揭幕中国拥有亿元资产的家庭达13.3万户周杰伦一审败诉网易男孩8年未见母亲被告知被遗忘许家印被限制高消费饲养员用铁锨驱打大熊猫被辞退男子被猫抓伤后确诊“猫抓病”特朗普无法缴纳4.54亿美元罚金倪萍分享减重40斤方法联合利华开始重组张家界的山上“长”满了韩国人?张立群任西安交通大学校长杨倩无缘巴黎奥运“重生之我在北大当嫡校长”黑马情侣提车了专访95后高颜值猪保姆考生莫言也上北大硕士复试名单了网友洛杉矶偶遇贾玲专家建议不必谈骨泥色变沉迷短剧的人就像掉进了杀猪盘奥巴马现身唐宁街 黑色着装引猜测七年后宇文玥被薅头发捞上岸事业单位女子向同事水杯投不明物质凯特王妃现身!外出购物视频曝光河南驻马店通报西平中学跳楼事件王树国卸任西安交大校长 师生送别恒大被罚41.75亿到底怎么缴男子被流浪猫绊倒 投喂者赔24万房客欠租失踪 房东直发愁西双版纳热带植物园回应蜉蝣大爆发钱人豪晒法院裁定实锤抄袭外国人感慨凌晨的中国很安全胖东来员工每周单休无小长假白宫:哈马斯三号人物被杀测试车高速逃费 小米:已补缴老人退休金被冒领16年 金额超20万