【数据可视化】前程无忧的工作信息可视化

前程无忧的工作信息可视化
使用python爬取前程无忧的工作信息,保存到Excel,并可视化(注意pyecharts包的版本,其次如果要做地理坐标图,热力图等,要安装地图包)。

一数据挖掘
代码所需要的包
import urllib.request
import xlwt
import re
import urllib.parse
import time
进入前程无忧网,以搜索Java职位信息为例


打开开发者模式
Request Headers 里面是我们用浏览器访问网站的信息,有了信息后就能模拟浏览器访问。这也是为了防止网站封禁IP,不过前程无忧一般是不会封IP的。


模拟浏览器
header={
'Host':'search.51job.com',
'Upgrade-Insecure-Requests':'1',
'User-Agent':'Mozilla/5.0 (Windows NT 10.0; WOW64) AppleWebKit/537.36 (KHTML, like Gecko) Chrome/79.0.3945.130 Safari/537.36'
}
以下基本信息都可以获取:


为了实现交互型爬取,我找了一个能够实现输入想了解的职位就能爬取相关内容的函数
def getfront(page, item): # page是页数,item是输入的字符串,见后文
result = urllib.parse.quote(item) # 先把字符串转成十六进制编码
ur1 = result + ',2,' + str(page) + '.html'
ur2 = ' https://search.51job.com/list/000000,000000,0000,00,9,99,'
res = ur2 + ur1 # 拼接网址
a = urllib.request.urlopen(res)
html = a.read().decode('gbk') # 读取源代码并转为unicode
return html
def getInformation(html):
reg = re.compile(r'class="t1 ">.*? <a target="_blank" title="(.*?)" href="(.*?)".*? <span class="t2"><a target="_blank" title="(.*?)" href="(.*?)".*?<span class="t3">(.*?)</span>.*?<span class="t4">(.*?)</span>.*?<span class="t5">(.*?)</span>.*?',re.S)#匹配换行符
items=re.findall(reg,html)
return items
使用Excel存储爬取的信息
#新建表格空间
excel1 = xlwt.Workbook()
# 设置单元格格式
sheet1 = excel1.add_sheet('Job', cell_overwrite_ok=True)
sheet1.write(0, 0, '序号')
sheet1.write(0, 1, '职位')
sheet1.write(0, 2, '公司名称')
sheet1.write(0, 3, '公司地点')
sheet1.write(0, 4, '公司性质')
sheet1.write(0, 5, '薪资')
sheet1.write(0, 6, '工作经验')
sheet1.write(0, 7, '学历要求')
sheet1.write(0, 8, '公司规模')
sheet1.write(0, 9, '公司类型')
sheet1.write(0, 10,'公司福利')
sheet1.write(0, 11,'发布时间')
爬取代码如下,这里就能利用双层循环来实现换页爬取与换行输出
number = 1
item = input()
for j in range(1,100): #页数自己随便改
try:
print("正在爬取第"+str(j)+"页数据...")
html = getfront(j,item) #调用获取网页原码
for i in getInformation(html):
try:
url1 = i[1] #职位网址
res1 = urllib.request.urlopen(url1).read().decode('gbk')
company = re.findall(re.compile(r'<div class="com_tag">.*?<p class="at" title="(.*?)"><span class="i_flag">.*?<p class="at" title="(.*?)">.*?<p class="at" title="(.*?)">.*?',re.S),res1)
job_need = re.findall(re.compile(r'<p class="msg ltype".*?>.*? <span>|</span> (.*?) <span>|</span> (.*?) <span>|</span> .*?</p>',re.S),res1)
welfare = re.findall(re.compile(r'<span class="sp4">(.*?)</span>',re.S),res1)
print(i[0],i[2],i[4],i[5],company[0][0],job_need[2][0],job_need[1][0],company[0][1],company[0][2],welfare,i[6])
sheet1.write(number,0,number)
sheet1.write(number,1,i[0]) sheet1.write(number,2,i[2])
sheet1.write(number,3,i[4]) sheet1.write(number,4,company[0][0]) sheet1.write(number,5,i[5])
sheet1.write(number,6,job_need[1][0])
sheet1.write(number,7,job_need[2][0])
sheet1.write(number,8,company[0][1])
sheet1.write(number,9,company[0][2])
sheet1.write(number,10,(" ".join(str(i) for i in welfare)))
sheet1.write(number,11,i[6])
number+=1 excel1.save("51job_00.xls")
time.sleep(0.3) #休息间隔,避免爬取海量数据时被误判为攻击,IP遭到封禁
except:
pass
except:
pass
爬取结果


二数据清洗
首先要打开文件
import pandas as pd
import re
#除此之外还要安装xlrd包
data = pd.read_excel(r'51job_00.xls',sheet_name='Job')
result = pd.DataFrame(data)
第一步清洗:出现空值的信息,直接删除整行
a = result.dropna(axis=0,how='any')
pd.set_option('display.max_rows',None) #输出全部行,不省略
第二步清洗:其他地方出现错误信息,比如学历中出现多少人
b2= u'人'
li2 = a['学历要求']
for i in range(0,len(li2)):
try:
if b2 in li2[i]:
number+=1
a = a.drop(i,axis=0)
except:
pass
第三步清洗:转换薪资单位
b3 =u'万/年'
b4 =u'千/月'
li3 = a['薪资']
#注释部分的print都是为了调试用的
for i in range(0,len(li3)):
try:
if b3 in li3[i]:
x = re.findall(r'\d*\.?\d+',li3[i])
min_ = format(float(x[0])/12,'.2f') #转换成浮点型并保留两位小数
max_ = format(float(x[1])/12,'.2f')
li3[i][1] = min_+'-'+max_+u'万/月'
if b4 in li3[i]:
x = re.findall(r'\d*\.?\d+',li3[i])
min_ = format(float(x[0])/10,'.2f')
max_ = format(float(x[1])/10,'.2f')
li3[i][1]= str(min_+'-'+max_+'万/月')
except:
pass
保存到另一个Excel中:
a.to_excel('51job_01.xls', sheet_name='Job', index=False)
三数据可视化
打开文件
file = pd.read_excel(r'51job_02.xlsx',sheet_name='Job')
f = pd.DataFrame(file)
pd.set_option('display.max_rows',None)
1、创建多个列表来单独存放【‘薪资’】【‘工作经验’】【‘学历要求’】【‘公司地点’】等信息
add = f['公司地点']
sly = f['薪资']
edu = f['学历要求']
exp = f['工作经验']
address =[]
salary = []
education = []
experience = []
for i in range(0,len(f)):
try:
a = add[i].split('-')
address.append(a[0])
s = re.findall(r'\d*\.?\d+',sly[i])
s1= float(s[0])
s2 =float(s[1])
salary.append([s1,s2])
education.append(edu[i])
experience.append(exp[i])
except:
pass
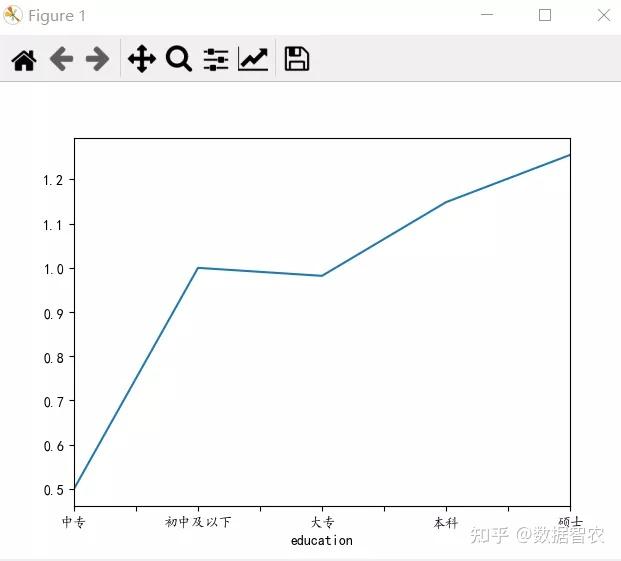
2、matploblib库生成 工作经验—薪资图 与 学历—薪资图
min_s=[] #定义存放最低薪资的列表
max_s=[] #定义存放最高薪资的列表
for i in range(0,len(experience)):
min_s.append(salary[i][0])
max_s.append(salary[i][0])
#matplotlib模块如果显示不了中文字符串可以用以下代码。
plt.rcParams['font.sans-serif'] = ['KaiTi'] # 指定默认字体
plt.rcParams['axes.unicode_minus'] = False # 解决保存图像是负号'-'显示为方块的问题
my_df = pd.DataFrame({'experience':experience, 'min_salay' : min_s, 'max_salay' : max_s}) #关联工作经验与薪资
data1 = my_df.groupby('experience').mean()['min_salay'].plot(kind='line')
plt.show()
my_df2 = pd.DataFrame({'education':education, 'min_salay' : min_s, 'max_salay' : max_s}) #关联学历与薪资
data2 = my_df2.groupby('education').mean()['min_salay'].plot(kind='line')
plt.show()


3、学历要求圆环图
def get_edu(list):
education2 = {}
for i in set(list):
education2[i] = list.count(i)
return education2
dir1 = get_edu(education)
pie = (Pie()
.add('', [list(z) for z in zip(dir1.keys(), dir1.values())],
radius=["30%", "75%"],
rosetype="radius") .set_global_opts(title_opts=opts.TitleOpts(title="Pie-基本示例", subtitle="学历要求")) .set_series_opts(label_opts=opts.LabelOpts(formatter="{b}: {d}%"))
)
pie.render('学历要求玫瑰图.html')


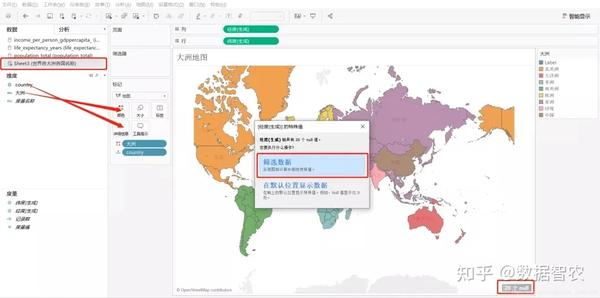
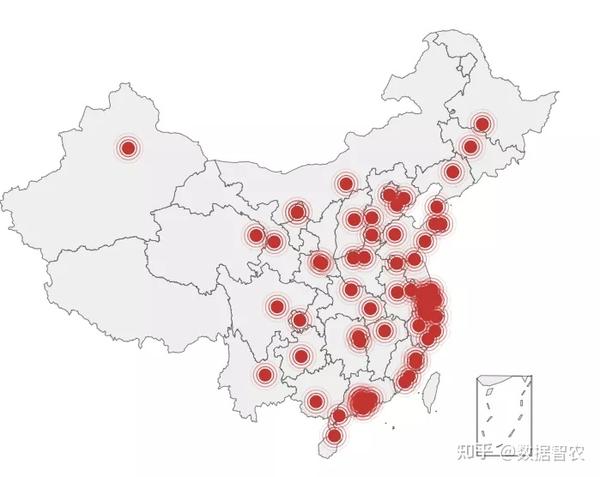
4、Java城市需求地理位置分布图
def get_address(list):
address2 = {}
for i in set(list):
address2[i] = list.count(i)
address2.pop('异地招聘')
# 有些地名可能不合法或者地图包里没有可以自行删除,之前以下名称都会报错,现在好像更新了
#address2.pop('山东')
#address2.pop('怒江')
#address2.pop('池州')
return address2
dir2 = get_address(address)
from pyecharts.globals import ChartType
c = (
Geo()
.add_schema(maptype="china")
.add(
"geo",
[list(z) for z in zip(dir2.keys(), dir2.values())],
type_=ChartType.EFFECT_SCATTER,
)
.set_series_opts(label_opts=opts.LabelOpts(is_show=False))
.set_global_opts(title_opts=opts.TitleOpts(title="Geo-Java人才需求分布图"))
.render("Java城市需求分布图.html")
)

5、工作经验要求漏斗图
def get_experience(list):
experience2 = {}
for i in set(list):
experience2[i] = list.count(i)
return experience2
dir3 = get_experience(experience)
#print(dir3)
from pyecharts import options as opts
from pyecharts.charts import Funnel
c = (
Funnel()
.add("", [list(z) for z in zip(dir3.keys(), dir3.values())]) .set_global_opts(title_opts=opts.TitleOpts(title=""))
.render("工作经验要求漏斗图.html")
)


长按二维码关注
如有任何问题
您可以发送邮件至
dataintellagr@126.com
或关注微博/知乎/微信后台留言
我们期待您的提问!
微博:数据智农
知乎:数据智农
邮箱:dataintellagr@126.com
制作:谭聪
推荐阅读
【数据可视化】各省份性别分布数据可视化


【数据可视化】1800-2019年世界人均收入与期望寿命的关系